Reliable monitoring of network device availability
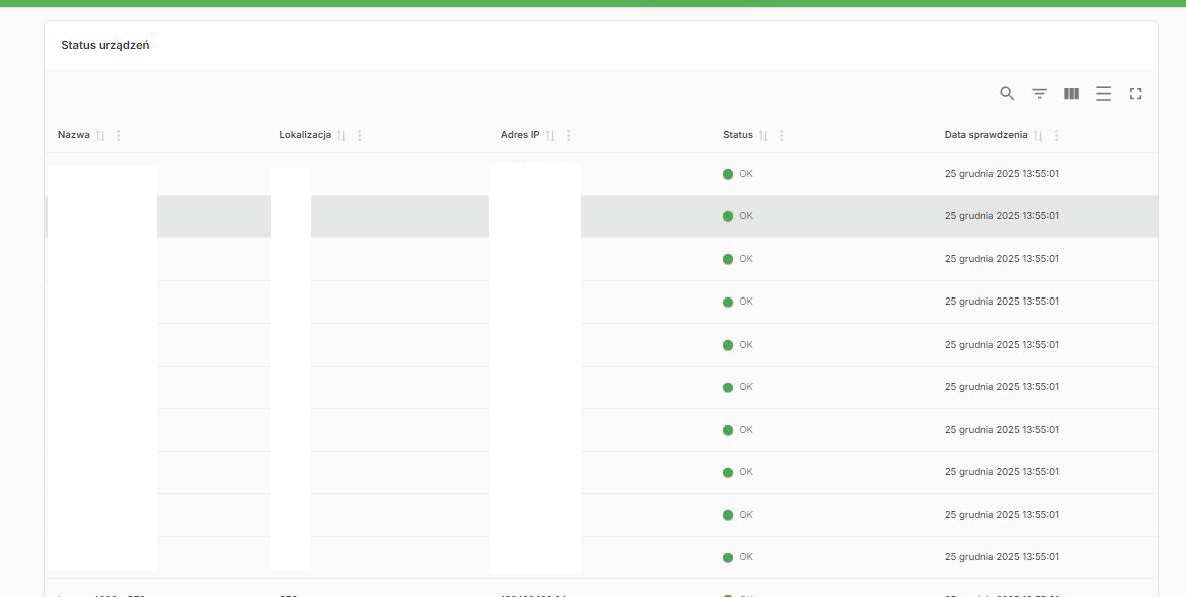
As part of this project, we developed an application for monitoring the availability of devices within a technical infrastructure. The system cyclically pings a predefined list of devices, enabling rapid detection of connectivity issues and continuous supervision of network status.
The solution was designed to be resilient to temporary communication disturbances while providing accurate reporting of real connectivity problems.
Source: internal implementation
Key project assumptions
- Cyclic pinging of a predefined list of devices at specified time intervals
- Detection of missing responses (timeouts) for individual hosts
- Sending connectivity loss events to the ELK stack (Elasticsearch, Logstash, Kibana)
- Reduction of false alarms caused by temporary network issues
- Email notifications sent only after repeated consecutive connection failures
- Container-based architecture enabling easy deployment and scalability
Solution architecture
The system was designed as a set of cooperating components:
- Python backend responsible for:
- cyclic device pinging,
- response and timeout analysis,
- event escalation logic,
- integration with the ELK stack,
- sending email notifications.
- Next.js frontend, providing:
- real-time overview of device availability,
- presentation of recent events and history,
- a clear and intuitive network status view.
- ELK (Elasticsearch, Logstash, Kibana) used as:
- a centralized event repository,
- a platform for analyzing and visualizing availability issues,
- support for diagnostics and reporting.
- Docker as the runtime layer, ensuring environment consistency and easy deployment.
Communication loss handling and event escalation
The system operates in a way that is resilient to temporary communication interruptions:
- single failed connection attempts are logged in the ELK system,
- the application tracks consecutive failed attempts per device,
- an email notification is generated only after a predefined failure threshold is exceeded.
This approach helps avoid excessive alerts and allows teams to focus on real infrastructure issues.
Data visualization and analysis with ELK and Next.js
Thanks to integration with Kibana, it is possible to:
- analyze historical events,
- identify recurring connectivity issues,
- quickly diagnose the overall network condition.
The Next.js frontend provides a clear presentation of the current system state and easy access to relevant information for users.
Technologies used
- Python – backend, monitoring logic, and notification handling
- Next.js – web frontend for data presentation
- Docker – containerization and deployment
- ELK (Elasticsearch, Logstash, Kibana) – centralized logging and event analysis
- Email notification system – controlled alerting
The system enables effective monitoring of device availability, rapid detection of connectivity problems, and in-depth analysis based on historical data.
If you are interested in implementing a similar solution for monitoring network infrastructure, feel free to contact us.